Support our educational content for free when you buy through links on our site. Learn more
📊 Assess Instructional Strategies: 5 Data-Driven Steps to Boost Outcomes (2026)
Ever felt like you’re teaching in the dark, hoping your lesson plan lands but unsure if it actually sticks? You’re not alone. Many educators rely on “gut feelings” or final grades to gauge success, but what if you could see exactly where a student gets stuck in real-time? Imagine knowing that 60% of your class missed a specific concept before the unit test, giving you the power to pivot instantly rather than waiting for a failing grade to tell you something went wrong. That is the transformative power of data-driven decision making.
In this comprehensive guide, we move beyond the dry academic jargon to show you exactly how to become a Data Detective in your own classroom. We’ll walk you through a proven 5-step framework to assess your teaching strategies, from setting clear “North Star” objectives to analyzing the subtle patterns in student performance. You’ll discover how to turn raw numbers into actionable insights, differentiate instruction with precision, and create a classroom culture where every student’s growth is visible and supported. By the end, you’ll have the tools to stop guessing and start knowing, ensuring your teaching strategies are not just effective, but exceptional.
Key Takeaways
- Shift from Intuition to Evidence: Replace “gut feelings” with real-time formative data to identify learning gaps before they become permanent.
- The 5-Step Framework: Learn a simple, repeatable process to set objectives, collect diverse data, analyze trends, design interventions, and measure impact.
- Student-Centric Action: Use data not to label students, but to differentiate instruction and provide targeted support that meets individual needs.
- Collaborative Growth: Leverage PLC (Professional Learning Community) data analysis to refine team teaching strategies and share successful interventions.
- Tech as an Enabler: Utilize tools like HMH Ed, Kahoot!, and Google Classroom to automate data collection and visualize student progress instantly.
Table of Contents
- ⚡️ Quick Tips and Facts
- 📜 From Gut Feeling to Data Gold: A Brief History of Instructional Assessment
- 🎯 Defining Your North Star: Setting Clear Learning Objectives and Success Criteria
- 📊 The Data Detective’s Toolkit: Essential Methods for Collecting Instructional Evidence
-
- 🧐 Formative Assessment Strategies That Actually Work in Real Time
-
- 📝 Sumative Assessment Analysis: Beyond the Final Grade
-
- 🗣️ Student Voice and Feedback Lops: Listening to the Learners
-
- 📈 Observational Data and Classroom Walkthroughs: Seeing What Tests Miss
-
- 🤖 Leveraging EdTech Platforms for Automated Data Collection
- 🧠 Making Sense of the Numbers: Analyzing Student Performance Data
-
- 📉 Identifying Trends, Patterns, and Outliers in Student Growth
-
- 🧩 Disagregating Data by Demographics and Learning Needs
-
- 🔄 Corelating Instructional Strategies with Student Achievement Gains
- 🚀 From Insight to Action: Designing Data-Driven Instructional Interventions
-
- 🛠️ Differentiating Instruction Based on Real-Time Data
-
- 🔄 Adjusting Pacing and Curriculum Scope Based on Mastery Levels
-
- 🤝 Collaborative PLCs: Using Data to Refine Team Teaching Strategies
- 🛡️ Overcoming the Hurdles: Common Pitfalls in Data-Driven Decision Making
- 📚 Recommended Links
- ❓ FAQ: Your Burning Questions About Instructional Data Answered
- 📖 Reference Links
⚡️ Quick Tips and Facts
Before we dive into the deep end of data analytics and instructional pivots, let’s hit the high notes that every educator needs to know right now. We’ve seen too many teachers burn out trying to track every single data point, so here is the Teacher Strategies™ reality check:
- Data is a Compass, Not a Cage: You aren’t building a prison for your students with numbers; you’re building a map. If the data says they are lost, you change the route, you don’t blame the student.
- The “So What?” Test: If you collect data and can’t answer “So what do I do differently tomorrow?” within 5 minutes, you are just collecting digital dust.
- Formative > Sumative: While final grades matter for report cards, formative assessment is the secret sauce for actual learning. It’s the difference between checking the temperature before the fever breaks and waiting until the patient is in the ICU.
- Student Agency: The most powerful data point often comes from the student themselves. When they track their own growth, engagement skyrockets.
- Tech is a Tool, Not a Teacher: No amount of fancy software can replace the human connection of a teacher noticing a furowed brow.
Pro Tip: If you are overwhelmed, start small. Pick one standard, one class, and one assessment method. Master that before trying to conquer the world.
For a deeper dive into the foundational methods, check out our guide on What are the 5 instructional teaching strategies? to see how these fit into the bigger picture.
📜 From Gut Feeling to Data Gold: A Brief History of Instructional Assessment

Let’s take a trip down memory lane, shall we? Decades ago, teaching was largely an art form driven by intuition and experience. If a teacher looked at a sea of blank stares and said, “I think they get it,” that was often good enough. We called it “the art of teaching,” but sometimes, it was just a guess.
Fast forward to the early 20s, and the pendulum swung hard toward standardized testing. Suddenly, everything was about the score. Schools were judged, teachers were ranked, and students were reduced to a single number. It was the era of “teaching to the test,” and while it brought accountability, it often stripped the joy out of learning.
Today, we are in the Data-Driven Instruction era, but with a twist. We aren’t just looking at scores; we are looking at trends, patterns, and individual growth. We’ve moved from “How did the class do?” to “How did Maria do on this specific concept compared to last week?”
According to HMH, a leader in educational resources, the goal is to balance the “science” of assessments with the “art” of relationships. As they state, “Knowing what learners know and can do is a critical part of teaching and learning.” This shift allows us to use data not just for grading, but to improve learner outcomes in real-time.
Why does this matter to you? Because you don’t have to choose between being a caring human and a data analyst. The best educators are both.
🎯 Defining Your North Star: Setting Clear Learning Objectives and Success Criteria
You can’t navigate a ship without a destination, and you can’t assess instruction without a North Star. In the classroom, this North Star is your Learning Objective.
Many teachers make the mistake of planning a lesson first and then figuring out what they want students to learn. It’s like baking a cake and then deciding what flavor you wanted. Backward design is the way to go.
The Anatomy of a Rock-Solid Objective
A vague objective like “Students will understand fractions” is a recipe for disaster. How do you measure “understand”? Instead, try: “Students will be able to add and subtract fractions with unlike denominators using visual models.”
Key Components:
- Action Verb: What will they do? (Add, subtract, analyze, create).
- Content: What are they doing it to? (Fractions, the Civil War, photosynthesis).
- Context/Constraint: How will they do it? (Using visual models, in a group, in 10 minutes).
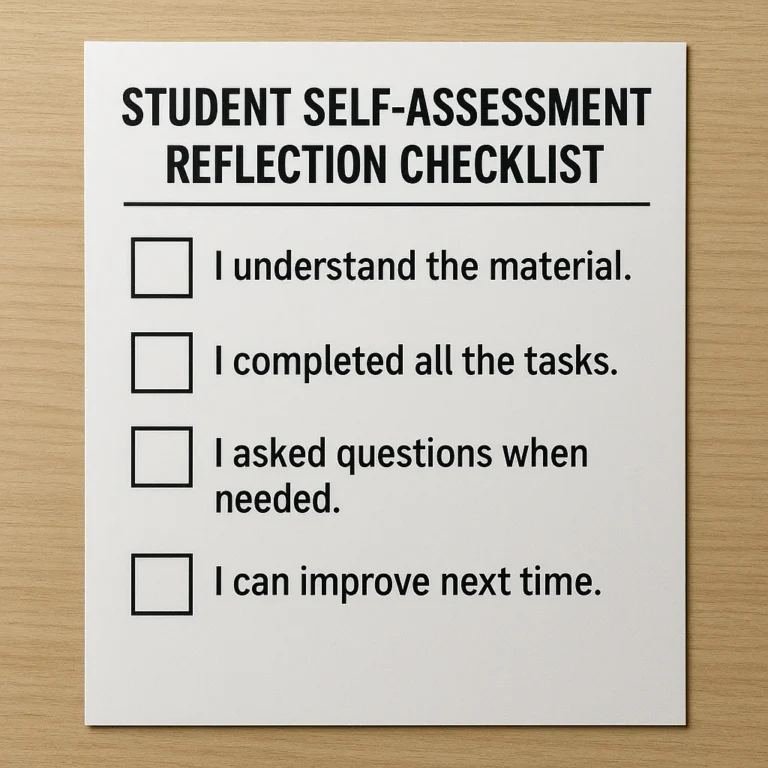
Once you have the objective, you need Success Criteria. These are the “I can” statements that students can understand.
- ❌ “I know what fractions are.”
- ✅ “I can draw a model to show 3/4 + 1/2.”
When students know exactly what success looks like, they become partners in their own learning. This aligns perfectly with our Assessment Techniques category, where we discuss how clarity drives achievement.
📊 The Data Detective’s Toolkit: Essential Methods for Collecting Instructional Evidence
Now, let’s get our detective hats on. 🕵️ ♀️ How do we gather the evidence? You need a mix of tools, because relying on just one source is like trying to diagnose an illness with only a thermometer.
1. 🧐 Formative Assessment Strategies That Actually Work in Real Time
Formative assessment is the heartbeat of data-driven instruction. It happens during the learning process.
- Exit Tickets: The classic for a reason. Ask one question that checks the day’s main concept.
Example: “Write one thing you learned and one question you still have.” - Think-Pair-Share: Listen in! The conversations students have with partners are gold mines of data. Are they using the right vocabulary? Are they misunderstanding the core concept?
- Digital Polls: Tools like Kahoot!, Mentimeter, or Google Forms give you instant visual data. If 60% of the class gets a question wrong, you know immediately to stop and reteach.
Teacher Story: I once taught a lesson on persuasive writing where I thought everyone was crushing it. I used a quick “Fist to Five” check (hold up fingers 0-5 to show confidence). Only two kids held up a 5. The rest were confused. We scrapped the next day’s plan and did a mini-lesson on evidence. The result? The final essays were 50% better. That’s the power of real-time data.
2. 📝 Sumative Assessment Analysis: Beyond the Final Grade
Sumative assessments (tests, projects, final essays) often get a bad rap. But they aren’t just for grades; they are for pattern recognition.
- Item Analysis: Don’t just look at the total score. Look at which questions were missed. Did everyone miss Question 4? That’s a teaching issue, not a student issue.
- Standard-Based Grading: Instead of an “A” or “B,” grade on specific standards. This tells you exactly which skills need reinforcement.
3. 🗣️ Student Voice and Feedback Lops: Listening to the Learners
Sometimes the best data isn’t a number; it’s a voice.
- Surveys: Ask students, “What part of this lesson was most confusing?” or “Which activity helped you learn the most?”
- Conferences: A 2-minute chat with a student can reveal more than a 50-question test.
4. 📈 Observational Data and Classroom Walkthroughs: Seeing What Tests Miss
Tests don’t show you engagement, collaboration, or behavioral patterns.
- Anecdotal Notes: Keep a clipboard or a digital app handy. Jot down observations: “Sarah struggled to start the task but finished quickly once she got help.”
- Peer Walkthroughs: Have a colleague observe your class. They might spot a pattern you’re too close to see.
5. 🤖 Leveraging EdTech Platforms for Automated Data Collection
Technology has revolutionized data collection. Platforms like HMH Ed, Canvas, or Schology can automatically aggregate data, saving you hours of manual entry.
Comparison of Popular Data Tools:
| Feature | HMH Ed | Google Classroom | Kahoot! |
|---|---|---|---|
| Primary Use | Comprehensive Curriculum & Assessment | LMS & Assignment Management | Gamified Formative Assessment |
| Data Depth | Deep (Standards, Domain, Growth) | Moderate (Completion, Grades) | High (Real-time engagement) |
| Reporting | Automated, Visual Dashboards | Basic Gradebook | Instant Class Reports |
| Best For | Long-term growth tracking | General organization | Quick checks for understanding |
👉 Shop HMH Ed on: Amazon | HMH Official Website
👉 Shop Google Classroom on: Google Workspace
👉 Shop Kahoot! on: Amazon | Kahoot! Official Website
🧠 Making Sense of the Numbers: Analyzing Student Performance Data
You have the data. Now what? This is where many teachers freeze. The spreadsheet looks like a foreign language. But fear not! We are going to decode it.
1. 📉 Identifying Trends, Patterns, and Outliers in Student Growth
Don’t look at a single test score in isolation. Look at the trajectory.
- The Trend Line: Is the student’s performance going up, down, or flatlining?
- The Outlier: Did one student score 98% while the class averaged 60%? Or did one student score 20% while the class averaged 80%? These outliers need immediate attention.
2. 🧩 Disagregating Data by Demographics and Learning Needs
This is crucial for equity. You must break down your data by:
- Subgroups: ELL students, Special Education, Gifted, Gender, Socioeconomic status.
- The “Why”: If your ELL students are consistently scoring low on reading comprehension, is it a reading issue or a language barrier?
- Action: If a subgroup is underperforming, you need a targeted intervention, not a “one-size-fits-all” reteach.
3. 🔄 Corelating Instructional Strategies with Student Achievement Gains
This is the holy grail. You need to ask: “Did my teaching method work?”
- Scenario A: You used a lecture for 20 minutes, then a quiz. Average score: 5%.
- Scenario B: You used a hands-on activity for 20 minutes, then a quiz. Average score: 85%.
- Conclusion: The hands-on activity was more effective for this specific concept. Pivot your strategy!
For more on how to adapt your teaching, explore our Differentiated Instruction resources.
🚀 From Insight to Action: Designing Data-Driven Instructional Interventions
Data without action is just noise. The magic happens when you turn insights into interventions.
1. 🛠️ Differentiating Instruction Based on Real-Time Data
Once you know who needs help and on what, you can differentiate.
- Tier 1 (Whole Class): If 80% of the class missed a concept, reteach the whole class using a different method.
- Tier 2 (Small Group): If 20% missed it, pull a small group for targeted practice.
- Tier 3 (Individual): If one student is struggling, provide 1-on-1 support or modified materials.
2. 🔄 Adjusting Pacing and Curriculum Scope Based on Mastery Levels
This is the hardest part for teachers: slowing down.
- The Dilemma: The curriculum map says “Move to Chapter 5,” but the data says “Chapter 4 is a disaster.”
- The Solution: Trust the data. If students haven’t mastered the prerequisite skills, moving on will only create a snowball effect of confusion. Pause and reteach.
3. 🤝 Collaborative PLCs: Using Data to Refine Team Teaching Strategies
You don’t have to do this alone. Professional Learning Communities (PLCs) are essential.
- The Process: Meet with your grade-level team. Bring your data. Ask: “What worked? What didn’t? How can we support each other?”
- The Benefit: When you share strategies that worked, the whole school improves. As noted in case studies from Mobile County Public School System, collaborative analysis led to expanded usage of targeted interventions like Math 180.
Wait, what if the data says my favorite lesson is terrible?
It’s painful, I know. But remember: It’s not about the teacher’s ego; it’s about the student’s growth. If the data says a lesson failed, you have a superpower: the ability to fix it before the year ends.
🛡️ Overcoming the Hurdles: Common Pitfalls in Data-Driven Decision Making
Even the best detectives make mistakes. Here are the traps to avoid:
- Analysis Paralysis: Spending more time analyzing data than teaching. Fix: Set a time limit. 30 minutes to analyze, the rest to plan.
- Data Overload: Trying to track every single metric. Fix: Focus on 3-5 key indicators per unit.
- Ignoring the Human Element: Relying solely on numbers and ignoring student behavior, engagement, or emotional state. Fix: Combine quantitative data with qualitative observations.
- The “Teaching to the Test” Trap: Narrowing the curriculum to only what is tested. Fix: Ensure your assessments measure deep understanding, not just rote memorization.
As the Regional Educational Laboratory (REL) Northeast & Islands emphasizes in their research, “Data and research are extremely important. If you’re going to change anything that’s happening within schools and with student outcomes, you have to be equipped with data.” But they also stress that this must be paired with professional development and technical assistance to be effective.
Conclusion

So, where does this leave us? We started with a simple question: How can I assess the effectiveness of my instructional teaching strategies?
The answer isn’t a single test or a fancy app. It’s a cycle.
- Set clear goals.
- Collect diverse data (formative, summative, observational).
- Analyze for patterns and correlations.
- Act with targeted interventions.
- Repeat.
It’s a journey from gut feeling to data gold. It requires courage to look at the numbers, humility to admit when a strategy didn’t work, and creativity to pivot on the fly. But the reward? Seeing every single student succeed because you tailored your teaching to their specific needs. That is the ultimate goal of education.
Remember, you are the architect of your classroom. Data is just your blueprint. Use it wisely, and you’ll build a learning environment where every student thrives.
📚 Recommended Links
Ready to take your data game to the next level? Here are some tools and resources we trust:
👉 Shop for Assessment Tools & Resources:
- HMH Ed Platform: Search on Amazon | HMH Official Website
- Kahoot! Premium: Search on Amazon | Kahoot! Official Website
- Formative Assessment Books: Search on Amazon
- Data-Driven Instruction Guides: Search on Amazon
Must-Read Books:
- Data-Driven Instruction: A Guide for Teachers by Douglas Reeves
- Formative Assessment: Making It Happen in the Classroom by Paul Black and Dylan Wiliam
❓ FAQ: Your Burning Questions About Instructional Data Answered

What role does technology play in collecting and analyzing data on student outcomes, and how can I leverage these tools to enhance my teaching practices?
Technology acts as a force multiplier. It automates the collection (saving you hours of grading) and visualizes the data (making patterns obvious).
- Leverage: Use platforms like Google Classroom or HMH Ed to generate instant reports. Don’t just look at the grade; look at the standard mastery reports.
- Enhancement: Use these tools to create personalized learning paths. If the software identifies a student struggling with fractions, it can automatically assign remedial practice, freeing you up to work with other students.
How can I use student assessment data to identify areas where my teaching strategies need improvement and inform my instructional decisions?
This is the corelation step.
- Isolate the variable: If 70% of the class fails a specific question, the problem is likely the instruction, not the student.
- Compare methods: Did the group that did the hands-on activity score higher than the group that listened to the lecture?
- Adjust: If a strategy consistently yields low scores, discard or modify it. Data gives you the evidence to say, “This isn’t working, let’s try something else.”
What are the key indicators of successful instructional teaching strategies that I should be tracking in my classroom?
Don’t just track test scores. Track:
- Growth over time: Are students improving from pre-test to post-test?
- Engagement levels: Are students participating? (Use observational data).
- Student self-efficacy: Do students believe they can learn? (Use surveys).
- Retention: Do they remember the concept a month later?
What are the best data-driven strategies for improving student outcomes?
- Immediate Feedback: Correcting misconceptions during the lesson, not after the test.
- Small Group Intervention: Pulling students who need extra help based on specific data points.
- Student-Led Data Tracking: Having students graph their own progress.
- PLC Collaboration: Analyzing data with colleagues to find best practices.
Read more about “Mastering Analysis in Lesson Plans: 12 Expert Strategies for Success (2026) 🎯”
How do I measure the effectiveness of different instructional teaching strategies?
You need a control and comparison approach.
- A/B Testing: Try Strategy A with one class and Strategy B with another (if possible) or use different days.
- Pre/Post Assessments: Measure growth before and after the specific strategy.
- Qualitative Feedback: Ask students which method helped them learn best.
Read more about “The 5 Instructional Strategies That Transform Classrooms (2026) 🚀”
What tools can teachers use to collect and analyze classroom data?
- Digital: Kahoot!, Quizz, Google Forms, HMH Ed, Canvas, Schology.
- Analog: Exit tickets, checklists, anecdotal note cards, whiteboard checks.
- Observation: Classroom walkthrough forms, video recording (with permission).
Read more about “🚀 25+ Classroom Instruction & Assessment Strategies for 2026”
How can I use assessment data to adjust my teaching methods in real time?
- The “Stop and Go” Rule: If more than 30% of the class gets a question wrong during a formative check, stop. Reteach immediately using a different modality (visual, kinesthetic, etc.).
- Flexible Grouping: Move students into different groups based on the day’s data. Today, Group A needs help with X; tomorrow, they might need help with Y.
📖 Reference Links
- HMH Blog: What is Data-Driven Instruction? – Core principles and case studies.
- Regional Educational Laboratory (REL) Northeast & Islands: Data and Research in Education – Insights on using data to improve outcomes.
- Taylor & Francis Online: School context, school leaders’ data-informed decision making, and… – Academic research on data-driven leadership (Note: Access may require institutional login).
- HMH Math 180: Tier 3 Math Intervention – Program details for struggling learners.
- Google Workspace for Education: Data and Analytics – Tools for classroom management and assessment.